Pattern Causality
Usage
# S4 method for class 'data.frame'
pc(
  data,
  target,
  source,
  libsizes = NULL,
  E = 3,
  k = E,
  tau = 1,
  style = 1,
  lib = NULL,
  pred = NULL,
  boot = 99,
  replace = FALSE,
  seed = 42L,
  dist.metric = c("euclidean", "manhattan", "maximum"),
  zero.tolerance = max(k),
  relative = TRUE,
  weighted = TRUE,
  threads = length(libsizes),
  higher.parallel = TRUE,
  verbose = TRUE,
  h = 0,
  ...
)

# S4 method for class 'sf'
pc(
  data,
  target,
  source,
  libsizes = NULL,
  E = 3,
  k = E + 1,
  tau = 1,
  style = 1,
  lib = NULL,
  pred = NULL,
  boot = 99,
  replace = FALSE,
  seed = 42L,
  dist.metric = c("euclidean", "manhattan", "maximum"),
  zero.tolerance = max(k),
  relative = TRUE,
  weighted = TRUE,
  threads = length(libsizes),
  higher.parallel = TRUE,
  verbose = TRUE,
  detrend = FALSE,
  nb = NULL,
  ...
)

# S4 method for class 'SpatRaster'
pc(
  data,
  target,
  source,
  libsizes = NULL,
  E = 3,
  k = E + 1,
  tau = 1,
  style = 1,
  lib = NULL,
  pred = NULL,
  boot = 99,
  replace = FALSE,
  seed = 42L,
  dist.metric = c("euclidean", "manhattan", "maximum"),
  zero.tolerance = max(k),
  relative = TRUE,
  weighted = TRUE,
  threads = length(libsizes),
  higher.parallel = TRUE,
  verbose = TRUE,
  detrend = FALSE,
  ...
)
Arguments
- data
Observation data.
- target
Integer of column indice for the target variable.
- source
Integer of column indice for the source variable.
- libsizes
(optional) Number of observations used.
- E
(optional) Embedding dimensions.
- k
(optional) Number of nearest neighbors used for projection.
- tau
(optional) Step of lag.
- style
(optional) Embedding style (
0includes current state,1excludes it).- lib
(optional) Libraries indices.
- pred
(optional) Predictions indices.
- boot
(optional) Number of bootstraps to perform.
- replace
(optional) Should sampling be with replacement?
- seed
(optional) Random seed.
- dist.metric
(optional) Distance measure to be used.
- zero.tolerance
(optional) Maximum number of zeros tolerated in signature space.
- relative
(optional) Whether to calculate relative changes in embedding.
- weighted
(optional) Whether to weight causal strength.
- threads
(optional) Number of threads used.
- higher.parallel
(optional) Whether to use a higher level of parallelism.
- verbose
(optional) Whether to show the progress bar.
- h
(optional) Prediction horizon.
- ...
Additional arguments to absorb unused inputs in method dispatch.
- detrend
(optional) Whether to remove the linear trend.
- nb
(optional) Neighbours list.
Value
A list.
- causality
A data.frame of causality results. When
libsizesisNULL, it contains per-sample causality estimates; otherwise, it contains causality results evaluated across different library sizes.- summary
A data.frame summarizing overall causality metrics. Only returned when
libsizesisNULL.
References
Stavroglou, S.K., Pantelous, A.A., Stanley, H.E., Zuev, K.M., 2020. Unveiling causal interactions in complex systems. Proceedings of the National Academy of Sciences 117, 7599–7605.
Examples
crash = sf::read_sf(system.file("case/crash.gpkg", package = "pc"))
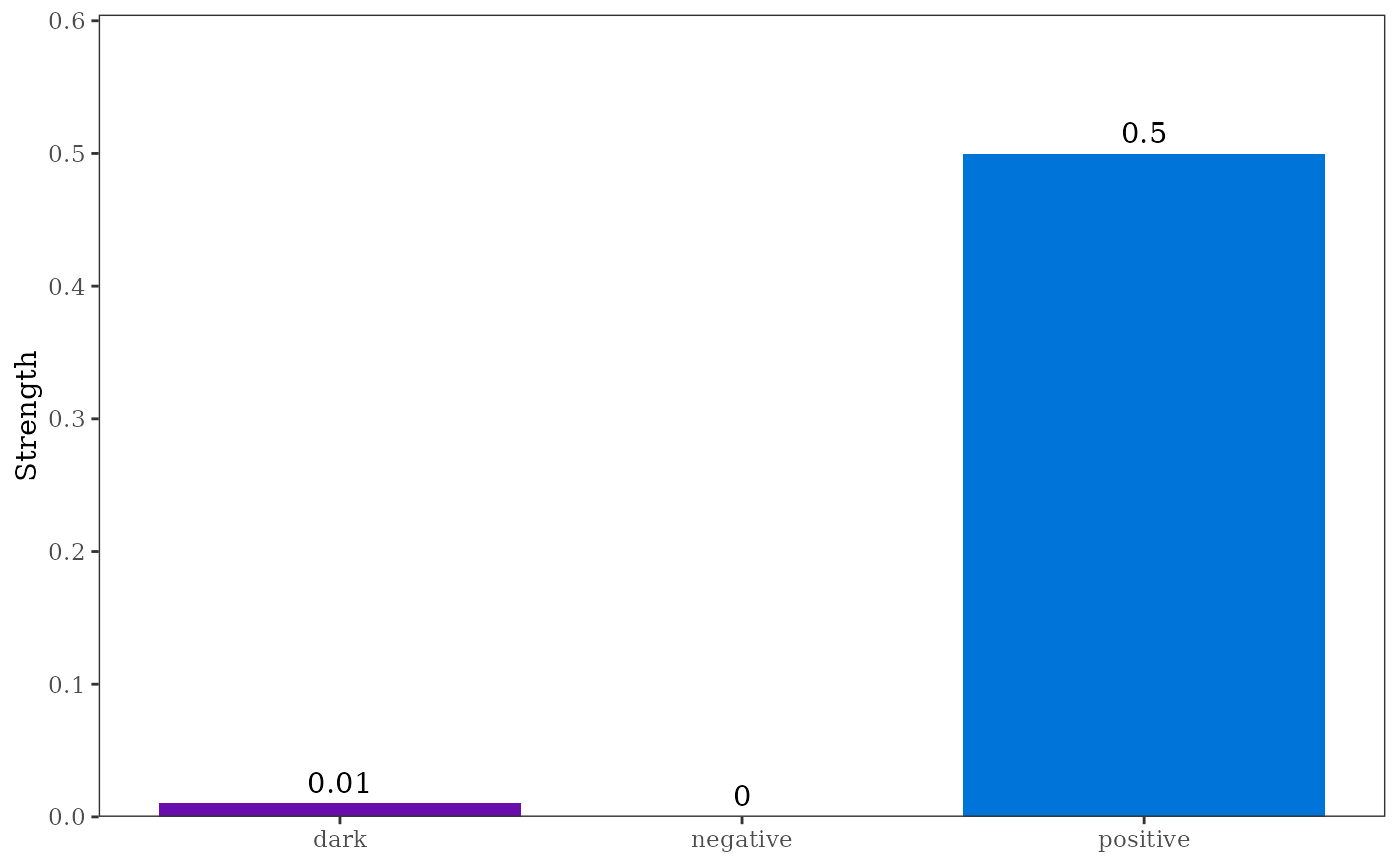
p1 = pc::pc(crash, 1, 2, E = 8, k = 8, threads = 1)
print(p1)
#> type strength
#> 1 positive 0.49969746
#> 2 negative 0.00000000
#> 3 dark 0.01034483
plot(p1)
 # convergence diagnostics
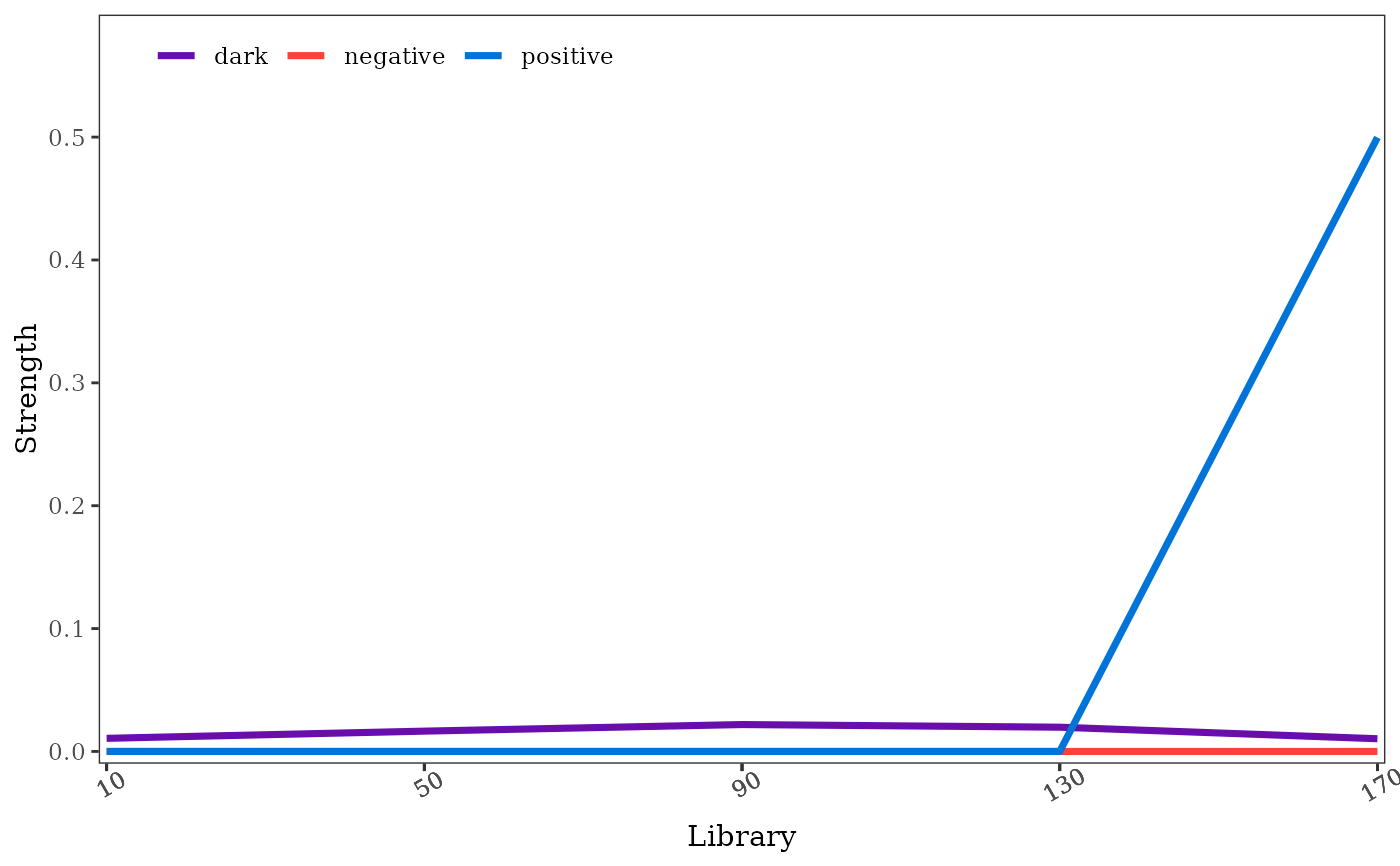
p2 = pc::pc(crash, 1, 2, libsizes = seq(10,172,40), E = 8, k = 8, threads = 1)
#>
Computing: [========================================] 100% (done)
print(p2)
#> libsizes type mean q05 q50 q95
#> 1 10 positive 0.015376669 0.000000000 0.00000000 0.00000000
#> 2 50 positive 0.063568472 0.000000000 0.00000000 0.49977149
#> 3 90 positive 0.136579574 0.000000000 0.00000000 0.99815552
#> 4 130 positive 0.186631291 0.000000000 0.00000000 0.99890072
#> 5 170 positive 0.476135903 0.299818474 0.49969746 0.49969746
#> 6 10 negative 0.011110787 0.000000000 0.00000000 0.00000000
#> 7 50 negative 0.065172928 0.000000000 0.00000000 0.49995337
#> 8 90 negative 0.005044505 0.000000000 0.00000000 0.00000000
#> 9 130 negative 0.000000000 0.000000000 0.00000000 0.00000000
#> 10 170 negative 0.000000000 0.000000000 0.00000000 0.00000000
#> 11 10 dark 0.012385738 0.000000000 0.01067757 0.02948670
#> 12 50 dark 0.017525127 0.002500290 0.01653382 0.03506015
#> 13 90 dark 0.022218695 0.006429697 0.02189141 0.04178204
#> 14 130 dark 0.021216780 0.006645161 0.01973684 0.04173889
#> 15 170 dark 0.011373253 0.006891828 0.01034483 0.01765704
plot(p2)
# convergence diagnostics
p2 = pc::pc(crash, 1, 2, libsizes = seq(10,172,40), E = 8, k = 8, threads = 1)
#>
Computing: [========================================] 100% (done)
print(p2)
#> libsizes type mean q05 q50 q95
#> 1 10 positive 0.015376669 0.000000000 0.00000000 0.00000000
#> 2 50 positive 0.063568472 0.000000000 0.00000000 0.49977149
#> 3 90 positive 0.136579574 0.000000000 0.00000000 0.99815552
#> 4 130 positive 0.186631291 0.000000000 0.00000000 0.99890072
#> 5 170 positive 0.476135903 0.299818474 0.49969746 0.49969746
#> 6 10 negative 0.011110787 0.000000000 0.00000000 0.00000000
#> 7 50 negative 0.065172928 0.000000000 0.00000000 0.49995337
#> 8 90 negative 0.005044505 0.000000000 0.00000000 0.00000000
#> 9 130 negative 0.000000000 0.000000000 0.00000000 0.00000000
#> 10 170 negative 0.000000000 0.000000000 0.00000000 0.00000000
#> 11 10 dark 0.012385738 0.000000000 0.01067757 0.02948670
#> 12 50 dark 0.017525127 0.002500290 0.01653382 0.03506015
#> 13 90 dark 0.022218695 0.006429697 0.02189141 0.04178204
#> 14 130 dark 0.021216780 0.006645161 0.01973684 0.04173889
#> 15 170 dark 0.011373253 0.006891828 0.01034483 0.01765704
plot(p2)